A lot of people are unaware that the UK’s 1.7 million postcodes are subject to changes – new additions, deletions and restorations every 3 months by the Ordnance Survey. And really quite a lot. We’ve just had 2,650 new additions, 1,103 deletions and 809 restored postcodes. You can always check how up to date on everything we are on this page.
Postcodes updated to Feb 2020
March 22nd, 2020UKCrimeStats still updating
March 20th, 2020As long as there is data to upload to our system, we will keep updating. No coronavirus problems – touch wood – with us.
It’s an interesting question though, how will the level and type of crime change during this period?
One hopes of course that it will go down and there’s a good chance it will. People are certainly going out less and that reduces the opportunity for criminals and victims of crime to interact. High Streets and railway stations because of their daytime population density tend to have much higher concentrations of crime. That is going to change because both these places are now deserted. Even burglaries are likely to go down because so many people are sitting this out at home.
So which crimes are likely to go up?
I shall leave that for another blog post. In the meantime, stay well and safe.
Crime updated to January 2020
March 4th, 2020Still no Greater Manchester Police data from July 2019 onwards – this does seem to be taking them a really long time, so please take what looks like really low crime in that area for that time period into account.
On a separate note, we are also moving to ONS codes for all our subdivisions – in the url, export file and tables. I realised we had to do this when I found out how time consuming it was to match the slightly different names from the Ordnance Survey to those from the Office of National Statistics. The former also classifies for example different types of local authority – e.g. Borough Council or Unitary Authority or District Council – but the latter just goes by code and a one word name.
Offering GoCardless as well as Paypal for UKCrimeStats subscriptions
March 4th, 2020So we have just started offering GoCardless as a method of payment for membership. GoCardless is an increasingly popular automated direct debit system, doesn’t require an app and can be a lot less trouble than a recurring Paypal payment. Not everyone likes Paypal and from a commercial point of view, it’s also takes quite a big margin from the value of the goods. Gocardless takes approximately half as much.
Anyway, we are giving you the choice – you are free to use Paypal or GoCardless when you subscribe.
Greater Manchester Police data still missing from July 2019
February 4th, 2020From July 2019 onwards, see here . I should add this is not our fault but according to our source data from:
https://data.police.uk/changelog/
“Greater Manchester Police: Due to a change in IT systems no crime or outcome data is available from July 2019 onwards. The force are working to rectify this issue and provide the missing data over the coming months.”
I’m totally sympathetic to IT projects running late but the country’s third largest city shouldn’t really have to do without crime data for 6 months.
Constituency Crime % changes – who’s right?
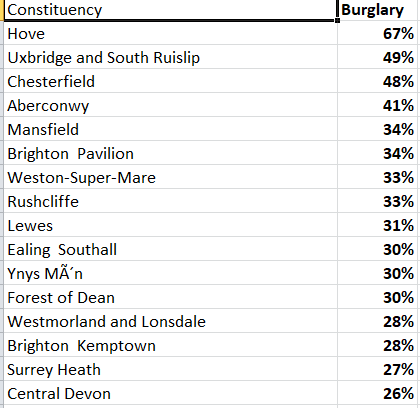
January 16th, 2020Just over a couple of weeks ago, the Sunday Times ran a story with the headline “Burglaries rise by 68% of Boris Johnson’s seat“. As we’ve been collating constituency level crime data for almost 9 years, I thought we’d see if our numbers agree.
And they didn’t.
On that figure alone, from our own data, there were 977 burglaries from Dec 2018-Nov 2019 and 657 from Dec 2017-Nov 2018, giving a 49% increase. So Boris’s seat – Uxbridge and South Ruislip – actually came second to Hove, not first, in the total percentage increase in burglaries.

During our investigations, we discovered what we believe is a bug in the api which we have just reported to data.police.uk – meaning that if you match a shapefile to the api, some crimes, some very far away, not in that shapefile will be matched to it.
Our methodology has always been to match the raw street level data to the shapefiles ourselves, making such an error not possible.
You can always find out yourself over any time period, how constituencies compare by subscribing to UKCrimeStats.com and running reports from the Constituencies page.
Monthly price going up soon
December 19th, 2019All existing subcribers will remain unchanged on £2.99 a month. Our new rate will be £4.99. Still great value and we’ve done a lot of improvements over the year with many more to come.
So if you’re thinking of subscribing as a monthly recurring payment, best to commit now to save money. Our annual and lifetime rates will remain unchanged.
Subscribers now see no ads
December 5th, 2019Google ads – which are set automatically by google – have suddenly got a lot more invasive of late on UKCrimeStats – I’ve even had to go through a page to get to where I want. So we’ve made a change for our subcribers. When they are logged in, there will be no ads displayed at all.
This actually makes the user experience far more agreeable. And another reason to subscribe.
Using the Heatmap
November 26th, 2019The leading crime and postcode data research and analysis platform


