France’s debt risk: CDS spreads or 10 year bond yields?

December 23rd, 2011

Ok – so much for France’s leaders instructing the ratings agencies to downgrade Britain. I don’t think for a moment that things are that great here but those agencies will have noticed that the UK’s position is better than France for some of the following rather important reasons;

i) Longer average maturities of British government bonds (gilts, we should say) –  13-14 years versus 7-10 years for France. This means that the French government has to raise more capital over a shorter period of time to pay its bills.

ii) Less foreign ownership of those government bonds – the BoE owns a lot – purchased from financial institutions – due to quantitative easing and will not dump them anytime soon, making yields shoot up

iii) Much, much less exposure of UK banks to Southern European sovereign debt – particularly Greece

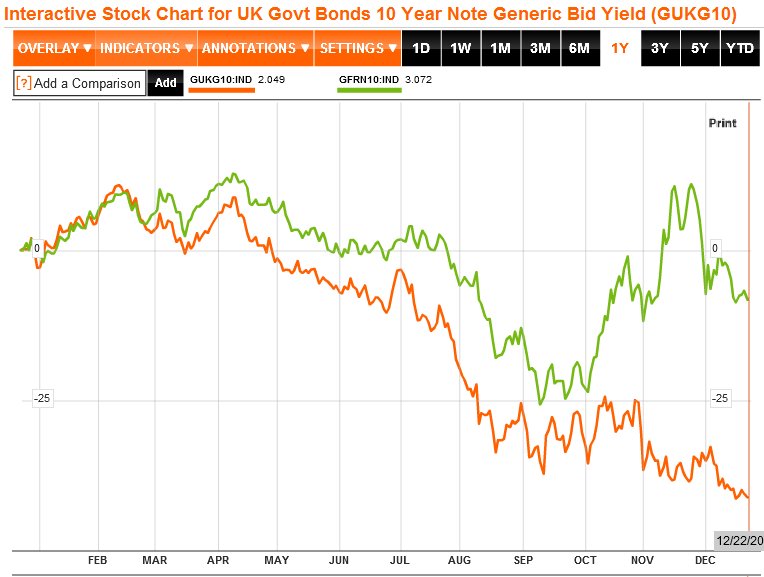
For these reasons and some others, the UK government currently (as at 22/12/2011) pays just over 1 % less for 10 year debt – 2.049% versus 3.072% – as per the chart from Bloomberg below.


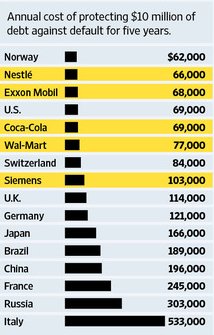
That’s bad enough. But yesterday I caught sight of a fascinating article in the WSJ, Super-Safe Assets Run Short Around Globe. As this table from the article shows, safety conscious investors appear to be putting a much higher premium on the cost of insuring French debt against default – more than two and a half times – than the UK’s over 5 years. In fact, the UK is even ahead of Germany.


CDS spreads are not a perfect guide to the future of course. And I’m not sure about Switzerland being behind the USA. Still, they do give us a rather more complete picture that includes investor sentiment – and right now, that is looking far from reassuring.


You can’t always blame crime on the weather

December 18th, 2011

Posted: December 18th, 2011  Author:   No Comments »

Last week, the Sunday Times used UKCrimeStats data – all of which in it’s raw form is freely available from Police.uk – to run a news feature entitled Austerity crimewave hits Britain. It was subsequently picked up by a number of other papers and radio stations. For obvious reasons, with a new recession probably on the way and public sector cuts just starting to come through, mostly in local government – many people are keen to see if there is any correlation to the overall crime rate or at least acquisitive crime.

Here’s the data in an open office spreadsheet which was always available free to view from our Police section with a small amount of exporting and formula work which I’ve done for you. There are a number of points that need to be made and have not been yet debated;

1. The Weather: According to a piece in today’s Sunday Sun and quoting UKCrimeStats- “POLICE say people in the North are turning to a life of crime to make “ends meet” after Government cuts” by Michael Brown. As you’ll see from the spreadsheet, the comparison is between monthly December 2010 and October 2011 totals. To paraphrase the article “ . . . these show that  burglary rates were 55.5% higher in Cleveland in October 2011 compared to December last year, while in Northumberland robberies have apparently rocketed”. But “ Northumberland Police assistant chief constable Jim Campbell rejected any comparison as “nonsensical” and blamed snow for the rise. “December 2010 was a month which saw the most severe weather conditions experienced in the north east for a generation,” he said.“The extreme weather conditions lasted throughout the entire month and undoubtedly suppressed crime levels across the entire force area”. 

That would make sense if you were to view Northumbria and Cleveland in isolation. The trouble is that the whole country had bad weather in December 2010, it was a national whiteout.

I do think there is a correlation between bad weather and lower crime and soon we will be overlaying weather data to have a more precise understanding of the correlation. The trouble is, Northumbria’s criticism doesn’t account for other parts of the country – that also had bad weather conditions – showing a marked fall in crime from December 2010. Was there an unknown freak mini-heatwave going on in the areas administered by Gwent Police in Wales and Thames Valley Police which both showed a 19% drop in burglaries? Soon with our weather data, we will be able to look back and know.

2. Month to month comparisons may not be perfect, but they are valid and interesting: I do agree that in the ideal academic world, to smooth out a seasonal variation, one month’s data should only be compared to that of the same month a year earlier. And then truth to tell, I don’t really agree. The Police themselves look at a time series of data, daily, weekly, monthly – with much more temporal granularity. They don’t wait 12 months to find out what’s really going on. Patterns and differences can emerge quite quickly over 43 Police Forces – it only takes 3 data points to see a trend and a fourth to break it, if it even exists.  It is nonetheless a reflection of what’s happening on the ground, across the country between two different time points. If the 43 Police Forces would like to release another 12 months of historical data prior to December 2010, we would be more than happy to upload it to UKCrimeStats.

3. The data should decide the headline, not the other way round: if you look at Cleveland’s page on our site, perhaps the most interesting question is not so much the jump between December 2010 and October 11 which was 55%.

It’s much more about the jump from Dec to January where it has remained remarkably flat – irrespective of the weather. I wonder what it was for November 2010? Media stories about rising crime may pique everyone’s interest more easily, but we should be equally  fascinated in learning where and why it has fallen in other areas at the same time.   There’s a story there too. Were those Forces pursuing different policies or is it something completely unrelated?  As you’ll see from our spreadsheet there is a far from uniform pattern of seasonal variation.

4. The days of the Home Office and Police Forces presenting crime statistics on their own terms with the best possible spin are (nearly) over: the crime data is out there available for everyone to see – it’s unrealistic to expect everyone to interpret it the way you’d like them to. Anyone looking at this site is free to draw their own conclusions based on what range of data they select. We have no control over that.

But let’s be clear – I have great admiration for the Police. Theirs is a very difficult job, damned for being too soft or too hard in a very political environment when most of them probably joined up thinking they were going to just fight crime – not ingratiate themselves with or go up against pressure groups and politicians. And as I have said here before, I reject entirely the idea that crime or the lack of it is 100% linked to Police effectiveness  (although if you read Cost of the Cops by Policy Exchange, there’s obviously much room for improvement). We are a post-religious society, broken in parts that is trying to find a new balance between freedom and responsibility. So I do support the idea of elected Police Commissioners. Not because this may lead necessarily to better policing policies that reduce crime although it probably will in the long run. Moreso because I sense that it is a far better method of getting more of the public to engage with the issues, restore faith in Law and Order and develop a sense for what is achievable and what is not.

EPC and platform UKCrimeStats in the Sunday Times today

December 11th, 2011

A major news feature in the Sunday Times today which draws on our increasingly successful platform, ask UKCrimeStats. All the data for the article, patient Austerity Crimewave hits Britain, comes from UKCrimeStats which the EPC owns.

UKCrimeStats and crime data in the Sunday Times today

December 11th, 2011

Posted: December 11th, store stuff 2011  Author:   No Comments »

A big news piece today in the Sunday Times today – Austerity crimewave hits Britain – who we worked with to compile the data about the austerity wave of crime across Britain. You may not have immediately realised from the feature article but all the data was compiled by this platform which the Economic Policy Centre owns. The report focuses on burglary and robbery across the different Police Forces between December 2010 and October 2011.

We find increasingly that media sources like the Sunday Times find it much easier to work with UKCrimeStats because we are independent, sickness case transparent and our platform thanks to careful design and database management can give context and meaning to the underlying data.

October 2011 data now live on UKCrimeStats

December 3rd, 2011

Posted: December 3rd, unhealthy 2011  Author:   No Comments »

We now have 11 months of aggregated data on UKCrimeStats – a special thanks again to our Chief Data Architect for working to make this available asap. We have some new upgrades coming through shortly which we’re excited about too – watch this space.

On a separate note – we are aware of – and will always be open about – some errors in the data (which we take from police.uk, unchanged) which have still not being fixed in the latest despite multiple proddings of the NPIA and RKH – amongst the worst is probably Cheshire Police (who we don’t blame) – their ASB figures for the first 3 months – just look at the chart and Sussex neighbourhood totals for December 2010 and January 2011 – still unavailable. We track these and others on the Forum part of our website.

I’ll be adding some more posts on the forum about data I’ve found which look suspect very shortly. Notably;

Lincolnshire Police – March 2011 Robbery and Vehicle totals

Wiltshire Police – March 2011 ASB total

Hertfordshire Constabulary – Jan 2011 ASB total

The original open data philosophy is just get it out there as fast as you can, treatment no matter how flawed it is, with little or no regard to data governance. This is flat wrong. It is as academically misinformed as the “experts” who told us in the early 90s, all that counted regarding privatisation in the ex-Soviet Block was speed and a liberal market economy is just a series of institutions – central bank, regulators, etc. – as if trust and corruption were immaterial. This misconstrued blind faith has in the worst case, arguably turned Russia into a nationalist oligarchy rather than an outwardly open democracy.

We know at UKCrimeStats how expensive and time-consuming it is to clean up the crime data and we don’t receive a penny for it or even a word of thanks. I could understand that in the first couple of months that not everything was right with such a large dataset and have said so frequently. But we’re now 10 months in, they’ve had all the time in the world to sort it out and there are no excuses any more.

Open data from government should not be immune from commercial standards of accuracy – especially if you’re paid by the Home Office allegedly £300k to release it in a format for developers and have now started charging for advice on the api.  Beat that for a vertically-integrated conflict of interest.

That’s why I am sceptical about the case for a £10 million Open Data Institute quango when just minor increases in data responsibility, resource and political will could lower the barriers to entry for developers and deliver the £6 billion open data economy (and possibly much more) the likes of Dr Rufus Pollock dreams about.