Our two entrants for #opendata #geovationchallenge

March 28th, 2012

Posted: March 28th, online 2012  Author:   No Comments »

Scaling-up crowdsourced community participation mashed up with open data can deliver some exciting solutions. So we were delighted to learn by chance about the geovation challenge last week which is supported by the Ordnance Survey as we can leverage what we have learnt and our capabilities from UKCrimeStats. These are brief summaries of our entrants and what we propose to do if we win a prize – feel free to comment, advice retweet, facebook like etc. on the Geovation website – our 2 ideas are here;

1. BikeSafe App:  – full details here

We believe we could develop an app that would go a long way to reducing and clearing up bike theft using our existing database www.ukcrimestats.com – based on police.uk data, police contacts and smartphone capabilities.

The key is to make it easy to register details for your bike, record your daily journeys and routes, make it very easy to register it as stolen and getting as many people as possible to sign up and in so doing, create a local and national picture that engages all the players, that did not exist before.

We believe that one of the most difficult crimes to solve is bicycle theft because these are relatively low value objects, easy to steal and massively underreported. Officially there were 115,147 bikes stolen in the UK in 2010 but the true figure is closer to more than half a million http://www.halfordspressoffice.com/Content/detail.aspx?NewsAreaId=2ReleaseID=874 – as was revealed by Halfords’ research because almost 80% of owners do not report their theft.

However, in order to create the stickiness and sense of community, we believe the value of using the app has to be to record daily commutes and routes used so that cyclists create a (private to view) history of their daily, weekly, yearly mileage.

2. Neighbourhood Action – Crowdsourcing Community Issues – full details here

Neighbourhood Action is a crowd-sourcing web-based platform that aims to significantly increase public participation in reporting local crime and community issues from the bottom up. Our local community depends on us to report issues that we’re unhappy with so that corrective action can be taken – but very few of us are actively doing this so it’s not representative. Neighbourhood Action solves this problem by making it easy to file your issue online in a free to view forum tied specifically to your local Police Team (using the www.ukcrimestats.com database with 5,000 plus neighbourhoods and Police Neighbourhood Teams), Council and Neighbourhood Watch representatives. The issue can then be voted on (only once per registered user). There would also be an email alert capability to everyone who is signed up to your neighbourhood as soon as a new issue is posted up. The more people participate, the easier it will be for the authorities to recognize and prioritize your issues and allocate adequate time and resources accordingly.

 

Our 2 entrants for #geovationc…

March 27th, 2012

Our 2 entrants for #geovationchallenge – Ending Bike Theft http://t.co/SoCFurMr & Crowdsourcing Neighbourhood Action http://t.co/08bknfk1

Crime in North Wales – what’s happening?

March 27th, 2012

Posted: March 26th, cure 2012  Author:   No Comments »

Last Saturday morning I was invited to speak at a workshop entitled “Will elected Police Commissioners make a difference?” organised by Richard Hibbs, discount the Independent Candidate for North Wales. It was an excellent event, and lots of different and engaging viewpoints – plurality in other words, which is what democracy is all about. And last but not least, it was in Llandudno, a true jewel of a town in North Wales. Much as I liked Richard, here at UKCrimeStats, as a rule, we don’t take sides behind any candidate as this would be a conflict of interest. We only look at the data and work hard to give it context and meaning over time periods, different boundaries etc. to the general populace.

Anyway, I thought you may like to see my presentation;

here is the powerpoint

here is the underlying data in two spreadsheets – North Wales by Neighbourhood and North Wales compared to all Police Forces.

I’m expecting to do quite a lot of these presentations over the next few months, so don’t hesitate to get in touch if you’d like an outside independent voice to tell you what your local crime data says. We are just starting now to work more with Local Authorities, Local Media and Insurance Companies who value our independence and flourishing capabilities.

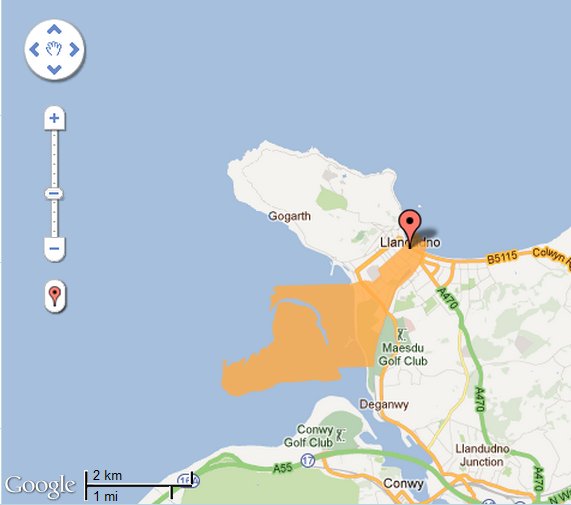
For all that, once again we found an open and shut case of why we need independent analysis by third parties of the crime data, because we alone seem to spot the errors and have a vested interest in making sure they are cleaned up. Take a look at the neighbourhood boundary of Mostyn in Llandudno which I’ve taken from Police.uk;

a good 60% of Mostyn’s neighbourhood boundary was in the sea – an incredibly bad error !

This is not something we can fix ourselves, we don’t know where the boundary should be. But as we use Police.uk data – and in this case, neighbourhood kml files we have no choice but to replicate it – here is our neighbourhood page for Mostyn. I’ve also written this up  on our forum where I direct the NPIA and the Home Office to get the details on the errors from.

So hopefully this will get fixed soon. Llandudno deserves better !

The last 3 years of national crime totals

March 23rd, 2012

Posted: March 23rd, health 2012  Author:   No Comments »

Here they are – I have sourced 2009 and 2010 data from table 2 of this pdf – Crime in England and Wales – and added in our own figures (which are from Police.uk) for 2011.

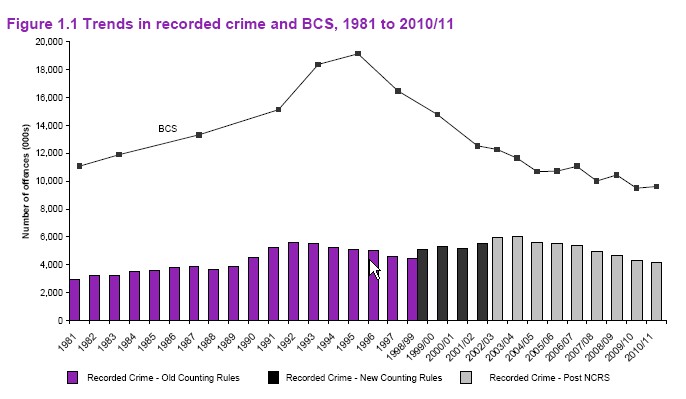
With a subscription to UKCrimeStats you can pick any monthly range of data from Dec 2010 so we were able to capture calendar 2011 and export the results to excel for easy totalling – the sum of which you see here. You might think the fact that officially recorded crime fell by 10% throughout the recession ought to be good news. But for some people – like this depressingly fact-free article in the Observer a few weeks ago – it doesn’t suit the political narrative that Police cuts = crime up. I know of course that recorded crime is quite different to the results from the British Crime Survey – we have covered this here. I also appreciate that the difference is large, as this chart shows;


For all that, where I differ with received opinion is that I’ve come to believe that national crime levels (England and Wales – with apologies to Welsh and English nationalists) are pretty much irrelevant.

95% of the time, most of us are either at home or at work – what really concerns us then is crime where we live or work. From the very start, we understood that at UKCrimeStats. No one feels safer because crime is down 10% over the last 3 years across England and Wales. What really draws their attention  is how does the area they live in measure up to other local areas and is it going up or down and in what category and how do they rank locally and nationally?

This is the sort of information you can find out with a subscription to UKCrimeStats – from just £9.99 a month.

Good piece – Analysis: Is the …

March 21st, 2012

Good piece – Analysis: Is the government’s open data drive in danger of stalling? – 21 Mar 2012 – Computing Analysis http://t.co/TPsRhLfG

Jan 2012 now live on UKCrimeStats – time to join

March 11th, 2012

Posted: March 10th, 2012  Author:   No Comments »

We now have a database of 7.6 million crimes and ASB incidents spanning the period Dec 2010 to Jan 2012. With a subscription starting at just £9.99 a month you can compare your selected crime types or all of them between Jan 2012 and Jan 2011 (or any other month or time period)  across all of these and export the data to excel.  You can even ask the database which of your selected type of locations had the biggest increase between time periods and export that data too. We’ve had a lot of compliments with what we’ve done with the data from Police Forces, Insurance Analysts, Journalists and Open Data and Database Enthusiasts and just everyday people who want a better idea than Police.uk can give them of what’s going on in their area. Our moving heatmap for anywhere in England and Wales is also a first.

UKCrimeStats is now a proven and media-trusted platform. To explore what membership of UKCrimeStats can discover for you, see our membership page here.

Finally, we are announcing a major new innovation next week too. And it’s still early days for what we can do with UKCrimeStats – so please keep watching this space and a big thankyou to all of you for your continued support.

Today’s “Broken Windows” would be based on Graffiti

March 10th, 2012

Posted: March 10th, search 2012  Author:   No Comments »

Broken Windows is probably the most influential criminological theory of the last few decades co-developed by James Q. Wilson and George L. Kelling. Wilson passed away a few days ago – read his obituary here – a very able academic, he clearly led a fulfilling and stimulating life.  

The original Broken Windows theory was laid out in March 1982 in this landmark article in Atlantic Monthly and it is still a compelling read.  If you have less time, here’s the wiki and for balance, here’s  some disagreement from an NGO. Broken Windows posits that the “fear of crime” which is all too often derided by some crimefighters is actually rationally grounded in the connection between disorderliness and urban and social decay.

1982 – 30 years ago – of course was a different world. Spray painting graffiti really hadn’t quite taken off and I do sense there are many fewer actually broken windows than back then, especially in the UK. Both the UK and the USA were then coming out of recession, downsizing manufacturing and ex-factories and businesses with broken windows were frequent sites. Since then, there’s been a lot of urban renewal and in the UK, we brought in Anti-Social Behavioural Orders which went some way to addressing low-level non-criminal offences which nonetheless created a fear of crime and came at a cost to the local community.

So I would argue that graffiti is today a much better indicator of urban and social decay as it is so much more prolific than broken windows. As the original Broken Windows article said at the time to the then emerging trend of subway graffiti in New York;

“As Nathan Glazer has written, the proliferation of graffiti, even when not obscene, confronts the subway rider with the inescapable knowledge that the environment he must endure for an hour or more a day is uncontrolled and uncontrollable, and that anyone can invade it to do whatever damage and mischief the mind suggests.”


Technology | The UK space econ…

March 7th, 2012

Technology | The UK space economy has lift-off: http://t.co/6xcPZYe4 via @AddThis – with copious quotes from Jim Bennett, store EPC Space Fellow

Why the January 2012 update is coming to you late next weekend

March 5th, 2012

Posted: March 5th, stuff 2012  Author:   No Comments »

Dear UKC followers and subscribers, ask

Normally, we aim to release our update within a week after Police.uk release theirs and often much sooner. So we owe you an apology and an explanation on why it’s later than usual.

First of all, Police.uk aim to release on the 25th of the month but this time, it was released on the morning of the 1st March. There was no explanation or less still, an apology on their behalf. In our view, this near-zero level of interraction with 3rd party developers has a lot to answer for. We have a number of outstanding queries too – some months old that require attention – just see our Forum page.

Secondly – and we’ve checked this a lot because we can hardly believe it – Police.uk have actually changed the underlying historical source data files located here without telling anyone – all the way back to December 2010 !

We know they’ve done this because we keep published historical records of all our data for everyone to see. This means that Police.uk has acted in direct contravention to the Home Office Crime Data Guidance which states;

 http://data.gov.uk/sites/default/files/Crime_Data_Guidance20101207.pdf  “When errors are discovered, or files are changed for other reasons, rather than ‘silently’ changing the file it is recommended to publish a revised and differently named version (together with the original files), e.g. 02_2011_v2, 02_2011_v1.

On neighbourhoods too, we are still awaiting an explanation from the authorities. It takes a lot of time to work out what has gone wrong, figure out  a solution and then process it through. We are now on the processing stage.

As a final word, we think this is an open and shut case of why it is so important to open up the crime data to third parties and developers. The more eyes look at it the better. Monopoly oversight and control of crime data is dangerous and prone to errors that will either not be discovered or silently changed from the inside – as appears to have happened here.  For open data to succeed, it has to be really ok for governments to say “Sorry, we’ve made a mistake” and publish the correction. After some upset, this openness builds public confidence in the crime data because new pressure is created to prevent a re-occurence. Quite the worst thing of all is to try and change it on the quiet and hope no one will notice.

Next week I have meeting with some officials at the Home Office to discuss points like these and the week after with the Crime and Justice Transparency Sector Panel of the Ministry of Justice.

It was a great achievement of the government to get 43 Police Forces to start releasing data simultaneously once a month. It is the largest publicly available crime dataset in the world by far. With open data like crime, we think the role of government should be to continuously improve it’s quality as well as it’s quantity as long as that does not undermine judicial process or anonymity. However, you can’t just release the data and walk away and say job done without engaging with those who use it.

The Future’s So Bright, it’s D…

March 2nd, 2012

The Future’s So Bright, it’s Dematerializing http://t.co/S4ddmM2t via @WSJ – good article – if we could weigh GDP each year it would be less