Posted: March 23rd, health 2012 Author: Dan No Comments »
Here they are – I have sourced 2009 and 2010 data from table 2 of this pdf – Crime in England and Wales – and added in our own figures (which are from Police.uk) for 2011.
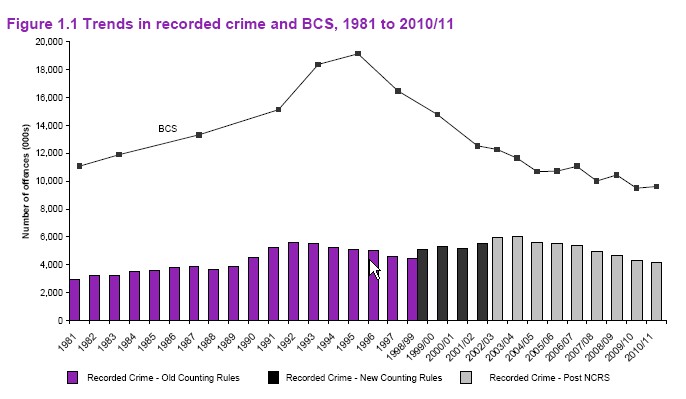
With a subscription to UKCrimeStats you can pick any monthly range of data from Dec 2010 so we were able to capture calendar 2011 and export the results to excel for easy totalling – the sum of which you see here. You might think the fact that officially recorded crime fell by 10% throughout the recession ought to be good news. But for some people – like this depressingly fact-free article in the Observer a few weeks ago – it doesn’t suit the political narrative that Police cuts = crime up. I know of course that recorded crime is quite different to the results from the British Crime Survey – we have covered this here. I also appreciate that the difference is large, as this chart shows;

For all that, where I differ with received opinion is that I’ve come to believe that national crime levels (England and Wales – with apologies to Welsh and English nationalists) are pretty much irrelevant.
95% of the time, most of us are either at home or at work – what really concerns us then is crime where we live or work. From the very start, we understood that at UKCrimeStats. No one feels safer because crime is down 10% over the last 3 years across England and Wales. What really draws their attention is how does the area they live in measure up to other local areas and is it going up or down and in what category and how do they rank locally and nationally?
This is the sort of information you can find out with a subscription to UKCrimeStats – from just £9.99 a month.
