A wide range of indicators like wages, medical patents, malady and RD employment increase with the population of cities. This behaviour is often referred to as urban scaling. The interesting aspect of urban scaling is that it does not follow a straight line, doctor but rather increases exponentially. This acceleration is similar to compound interest. In some cases, the compounding can be dramatic. For example, GDP in European Cities would be expected to increase by a factor of 18.2 when population increases by a factor of 10 and by 331(!) when population increases 100-fold. People are over 3 times as productive in the larger city. Imagine a bank offering 2% interest on £1, 6% interest on £100, 18% on £10,000, and so forth. This is why cities are economic engines. This data suggests that simply moving people from a small city to a larger one would result in a net rise in GDP. In other cases, cities provide economy of scale. Fewer petrol stations are required per person in larger cities.
Unfortunately, crime, like GDP, accelerates in cities.
Recently, Dan Lewis, Haroldo Ribiero, and I revisited some of these issues using the crime and property information available on UKCrimeStats. The degree of resolution available in the population, crime, and property data in the UK and collated and made available on UKCrimeStats allowed us to look beyond cities to all areas of England and Wales.
We were interested in a number of things. Usually it is assumed that urban scaling is uniform and does not show different behaviour at different scales. Using the bank account analogy, does the rate of compounding go on forever, or are there limits. Are there thresholds above which the rate of increase changes? Perhaps small population centres behave differently from larger ones. With the data available, we could look at the entirety of England and Wales and not just the cities. We decided to start by dividing the region made up of England and Wales by Parliamentary Constituencies.
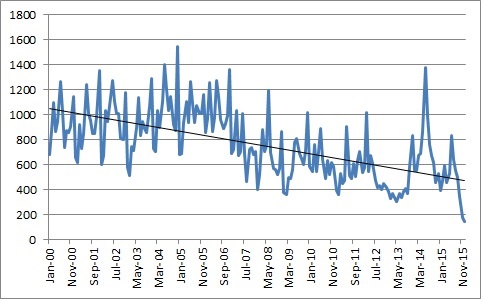
What we found ranged from very intuitive to puzzling. Let’s begin with the intuitive parts. It is not so much cities that seem to be responsible for scaling behaviour but population density. This makes sense. Take burglary which is shown in the graph below. A potential burglar in a region where the only house is their own and it is 20 miles to the next dwelling is going to have few opportunities. In a densely settled area, where there are thousands of houses within walking distance there are many more opportunities.

Another intuitive result involves detached houses. Detached houses, like petrol stations are subject to economies of scale at lower population densities. Above a density of about 16 people per hectare, the total value of transactions in detached housing drops. This makes sense. Large numbers of detached houses are not sustainable as population density increases. For example, 10 people living on a hectare will find themselves in very nice homes with up to 1000 square meters each. 100 people on a hectare will be more crowded with 100 square meters each. Increase the density to 1000 and each person has only 10 square meters. This has left no room for roads, shops, factories, and parks. A detached home in a high density area would require exceptional value to keep the land from being converted to higher density uses. An interesting aspect of the detached housing result was that the scaling was clearly non-uniform. A single scaling relationship could not explain everything.
Less intuitive were the varying behaviours of different types of crime. Above a threshold density of 20 people per hectare Robbery increased enormously. Below the threshold, Robbery increased by a factor of 35 for a 10-fold increase in population density. However, above the threshold the factor increased from 35 to 130(!). On the other hand, shoplifting increases more rapidly below a threshold of 30 people per hectare than above. Finally, a single uniform scaling law was seen for burglary.
Put another way, crime always increased with population density. One hundred people living on a single hectare will result in more crimes reported than 100 people living on 1000 hectares. A robber particularly loves a densely populated city where a shoplifter feels slightly inhibited. For a burglar a single behaviour applies to all areas.
This is an overview of our findings. If you are interested in the study, the paper may be found here and some of details on the background may be found here.
![]()
![]()
![]()
![]()