
A guest post by Quention Hanley:
Roughly two years ago, we pointed out a key feature of crime: its tendency to accelerate as population density increases. This type of behaviour has been observed many times in many parts of the world. The features of cities and urban regions that increase opportunity for crime also accelerate property values and productivity.
Recently, Dan Lewis, Haroldo Ribeiro and I looked deeper into the data set of police reported crime and property transactions. We wanted to understand better how to measure a location’s uniqueness and how different measures relate to each other.
How can we define what makes a location special? First we need to remove the part that is predictable due to population density and see what is left. In simple terms, some places are special. We expect a region to have a particular amount of crime but see less (possibly much less). Another location may have a much healthier property market than we expect. These are examples of regions that are better than expected. The opposite may be true. We see more crime and a depressed property market. In our study, we call this information density scale adjusted metrics (DSAMs).
We took all this information and tried to understand patterns. How do different indicators relate to each other? Do wealthy neighbourhoods (based on a healthy property market) attract burglars?
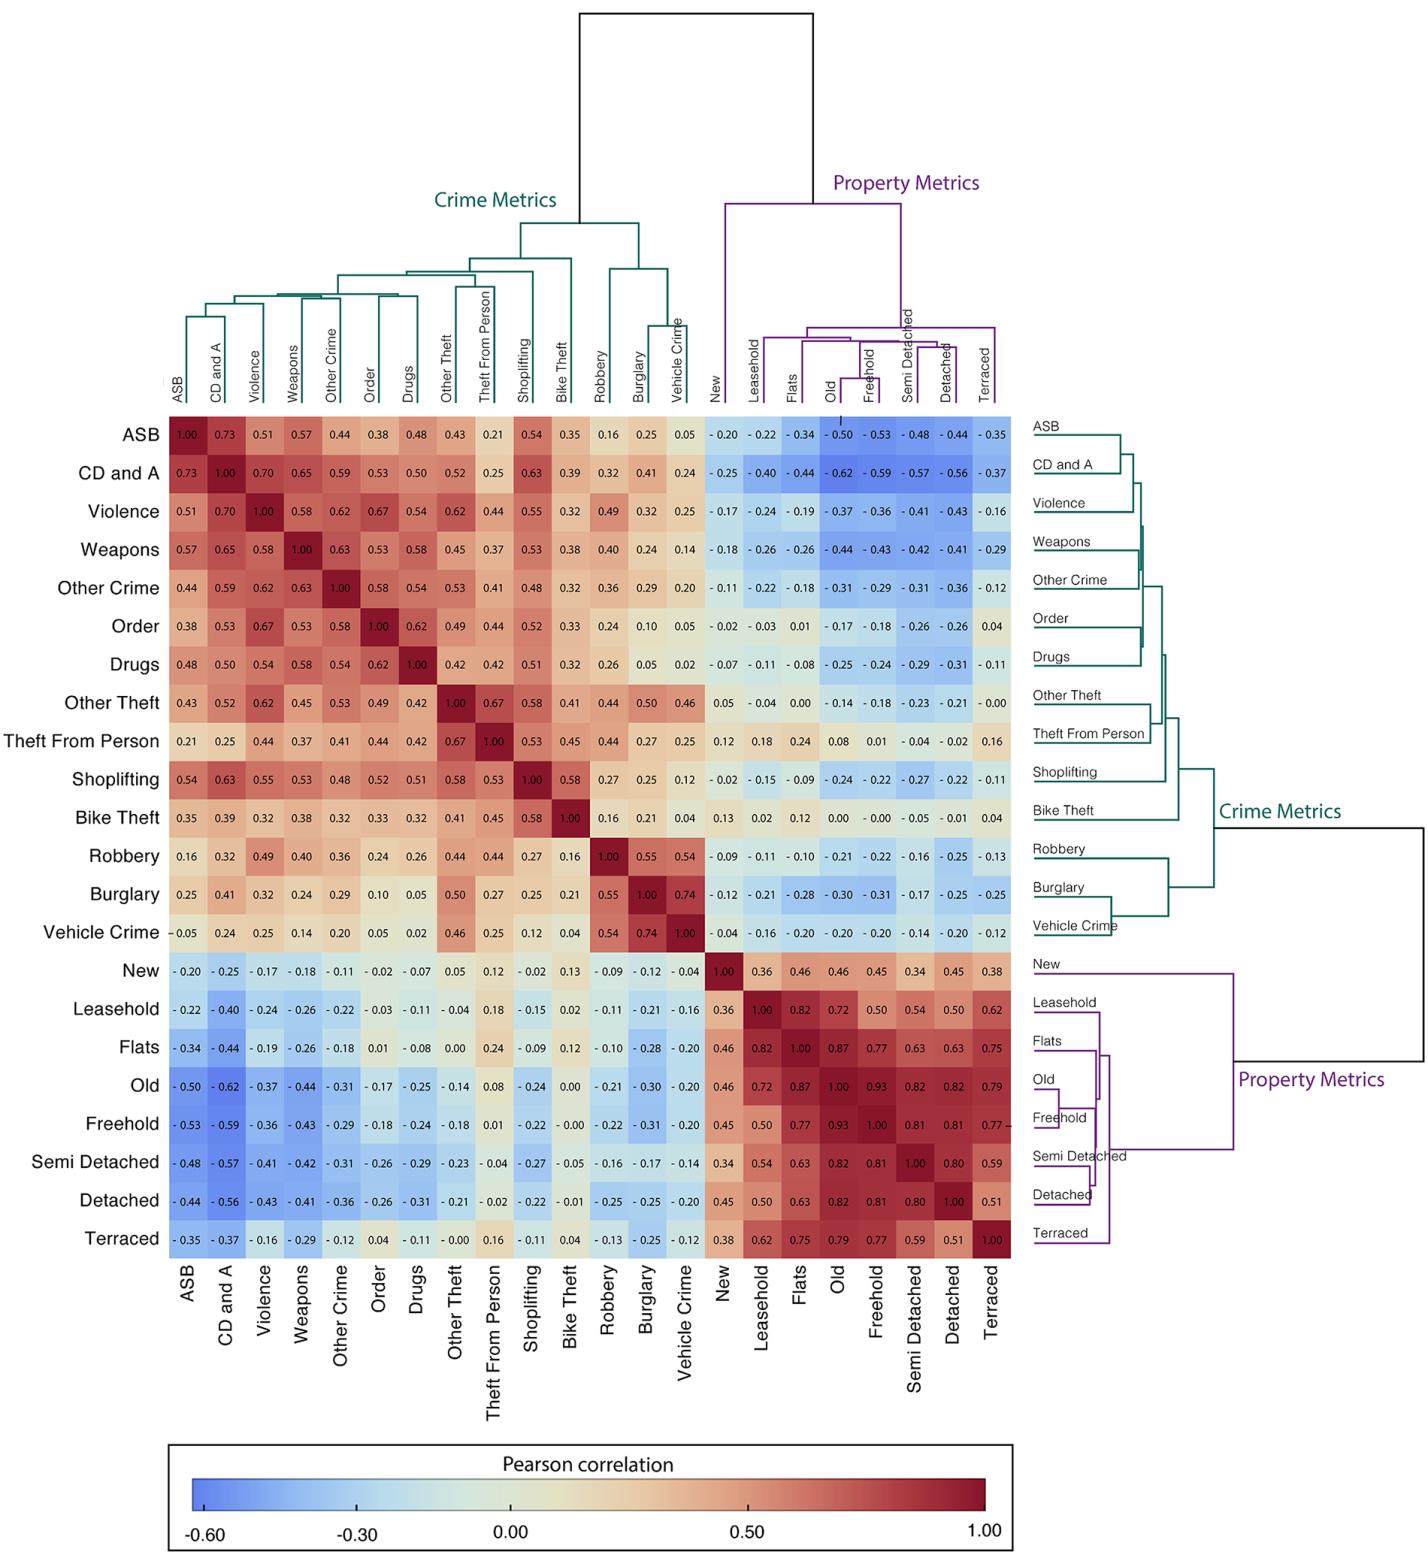
The figure below is a way of presenting what we found. The red colours show positive correlation (e.g. Anti-social behaviour (ASB) is strongly associate with criminal damage and arson (CDA)) and blue colours indicate negative correlation (e.g. CDA is high where property indicators are low). Overall, this figure indicates that if you live in a region with an exceptionally buoyant property market you are also likely to be exceptionally safe from crime.
The figure also sorts crime and property types into hierarchies. For example, Robbery, Vehicle crime, and Burglary form a cluster but are relatively distant from another cluster consisting of ASB, CDA and Violence.
This helps us to understand how measures of exceptionality relate to each other but the two dimensional grid presentation limits our perception to paired behaviours. We can also look at this as a complex network as in the figure below.
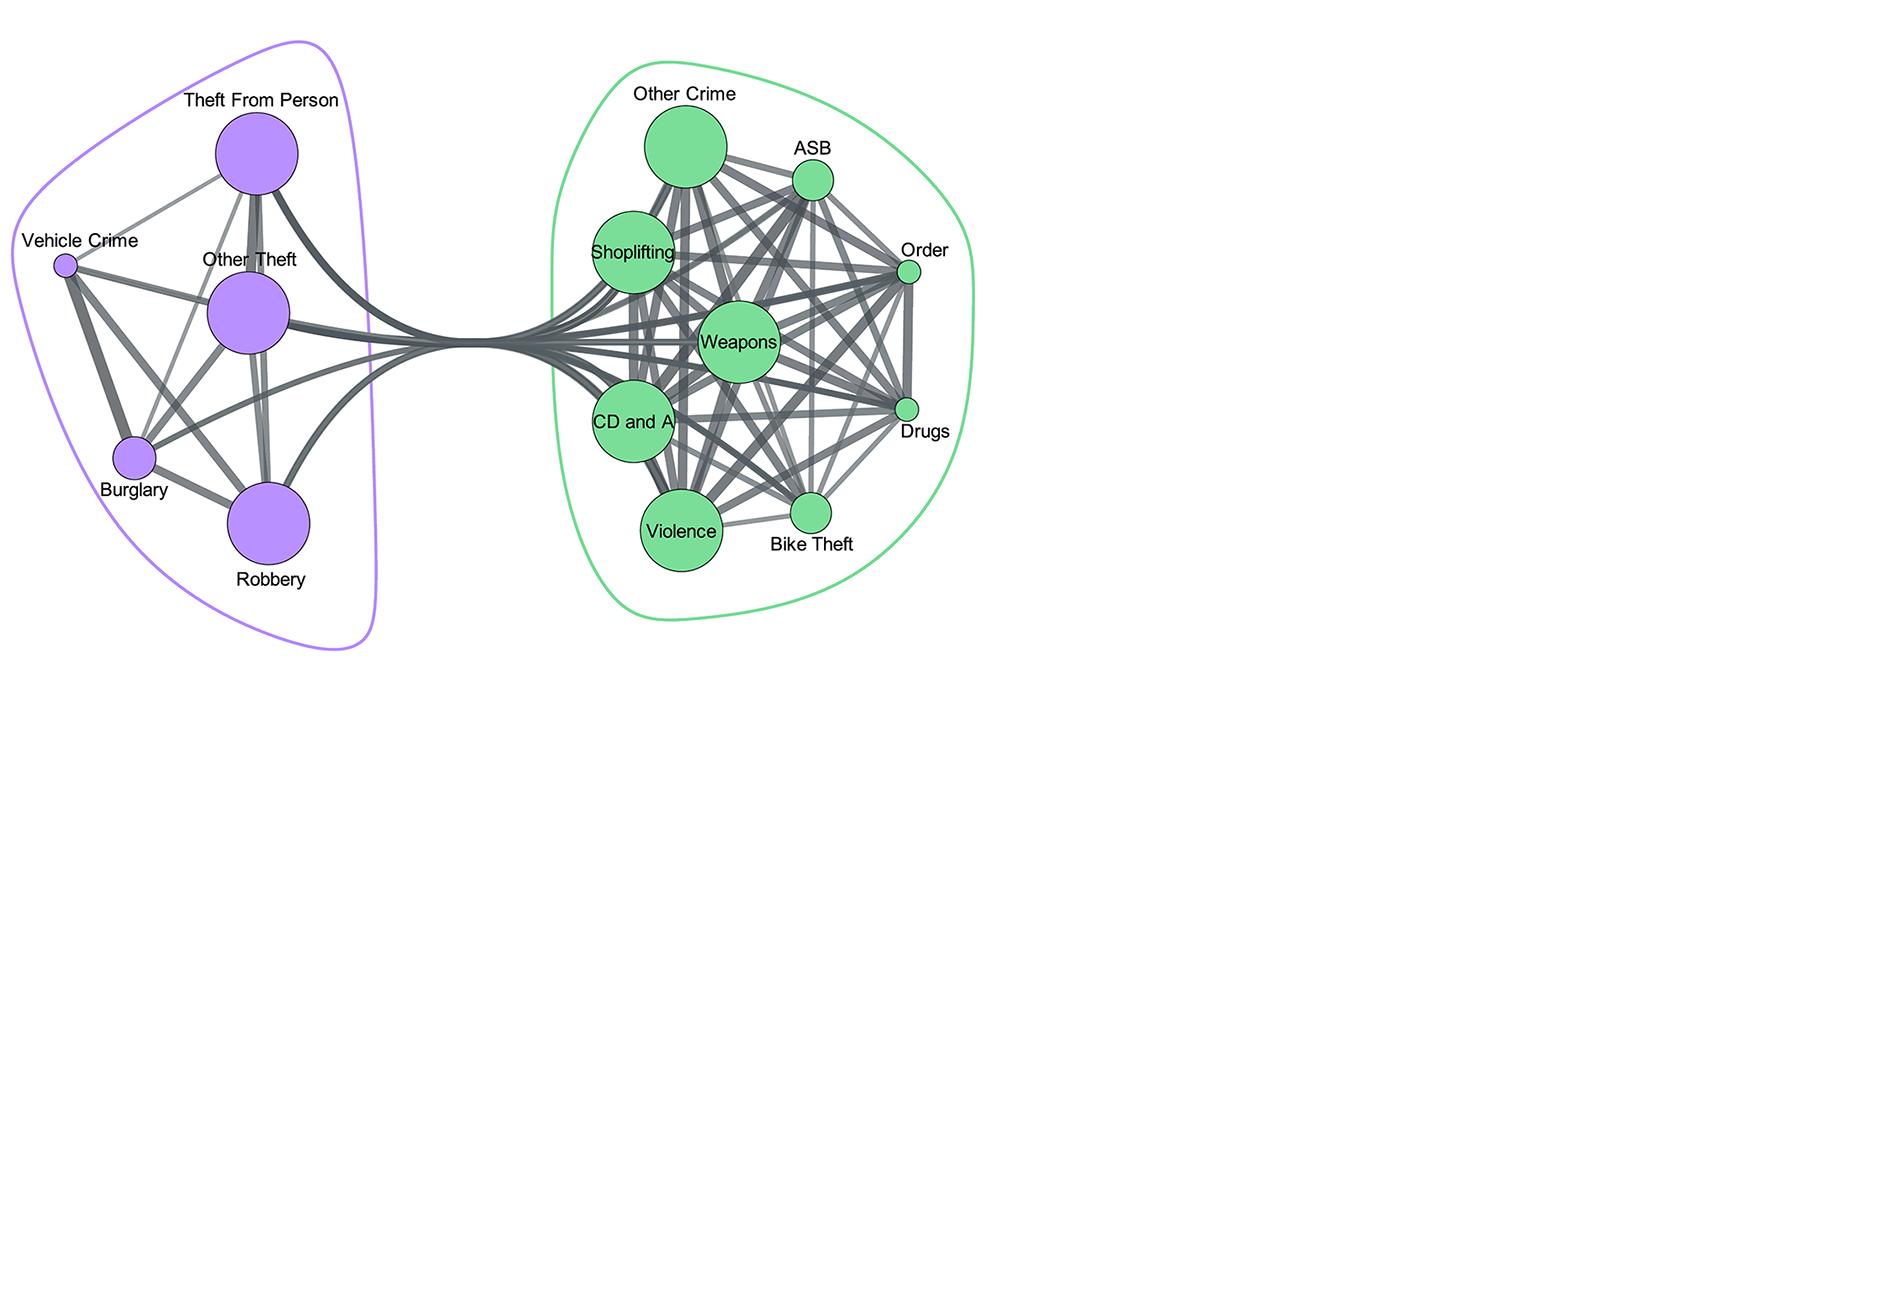
If we do this we can see a modular structure for crime dividing it into two groups roughly divided into acquisitive types of crime and all others. The division is not perfect but clearly one module contains the more violent and aggressive crime types and the other many of the acquisitive crimes. Although not easy to see, CDA is the crime with the highest connectivity to the other crime types in its module. In our study, we found that CDA was one of the most influential crime types in terms of its connectedness to other serious crimes like violence and weapons. It also was associated with depressed markets across all property types.
We hope this type of study helps us understand how to protect communities and allocate scarce resources better. If you are interested in the study beyond this general overview, the paper may be found here.


