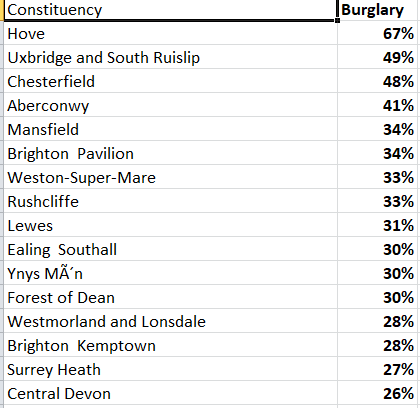
Just over a couple of weeks ago, the Sunday Times ran a story with the headline “Burglaries rise by 68% of Boris Johnson’s seat“. As we’ve been collating constituency level crime data for almost 9 years, I thought we’d see if our numbers agree.
And they didn’t.
On that figure alone, from our own data, there were 977 burglaries from Dec 2018-Nov 2019 and 657 from Dec 2017-Nov 2018, giving a 49% increase. So Boris’s seat – Uxbridge and South Ruislip – actually came second to Hove, not first, in the total percentage increase in burglaries.

During our investigations, we discovered what we believe is a bug in the api which we have just reported to data.police.uk – meaning that if you match a shapefile to the api, some crimes, some very far away, not in that shapefile will be matched to it.
Our methodology has always been to match the raw street level data to the shapefiles ourselves, making such an error not possible.
You can always find out yourself over any time period, how constituencies compare by subscribing to UKCrimeStats.com and running reports from the Constituencies page.

