All England and Wales postcodes now matched automatically to LSOAs and MSOAs

December 6th, 2013

Posted: December 6th, sovaldi sale 2013  Author:   No Comments »

This has been running for a while but I realised it was time to tell you.  Here at UKCrimeStats, here we make lots of incremental improvements all the time – so much work goes into this platform. So, try if you type in your postcode to the searchbox and scroll down the results to the bottom, you will see the matching Lower Layer Super Output Area and Middle Super Output Area. We’ll also be doing this shortly with Northern Ireland Super Output Areas. Still no monthly crime data from Scotland. Who knows, by the time it is available, it may not be in the UK anymore and we’ll need a new website name !

October 2013 update coming through shortly.

Top 10 Postcode Sectors for Bike Theft

September 12th, 2013

Posted: September 12th, remedy decease 2013  Author:   No Comments »

We have just run the update for May 2013 and are currently debugging a few issues before we go ahead with June and then July. But I have for some time been fascinated by the crime of Bike Theft. We put it to the Home Office to include this as a sector 2 years ago and are glad to see that since May they have included it. Last year, treat pharm we also entered the ONS Geovation competition to win sponsorship money to build an anti-bike theft app. In fact, troche buy I event went to visit a major bike retailer to drum up some support but alas, none was forthcoming. Anyway, one month’s data doesn’t tell you everything. It takes time to build up a picture, but to give you a taster, here are the top 10 Postcode Sectors for Bike Theft in May 2013 and the number of reported bikes stolen.

Oxford and Cambridge you’d have to expect. But the real surprise to me was Maida Vale, W9 4 coming in at number 1 across England and Wales – 2.5 times worse than the worst area in Oxford.

Launch of Postcode Data Generator – up to 5,000 postcodes at once

July 10th, 2013

Posted: July 10th, try 2013  Author:   tadalafil 000 postcodes at once”>No Comments »

Today we launch our Postcode Data Generator;

http://www.ukcrimestats.com/PostcodeTool/

Costing just £19.95 for up to 5, sales 000 postcodes, the PDG  is the cost-effective choice for Insurance Companies, Academics, Security Analysts, Police Crime Commissioners, Journalists, Estate Agents, Geospatial Analysts, Policy Professionals and Everyday People. To match crime, income, population, environmental and other data for your list of UK postcodes, upload below a simple .txt file of postcodes and it will send back to you a zipped up folder. All details are here.

We will keep refining this as time goes on, so all feedback most welcome.

Why I support elected PCCs – in a nutshell

September 8th, 2012

Posted: September 8th, 2012  Author:   No Comments »

Here goes;

There seems to be a sizeable difference of opinion between what the general public think the Police can achieve and what the Police think the general public actually want.  Elected PCCs should go some way to closing that gap. But this new system will take time to bed down. As political wags will tell you, sale the first test of a democratic society is not the first election, but the second and it’s just the same with these new elected officials. We will need a good 10 years of PCCs in order to tell how successful they have been.

And expect some failures as well as successes – which it what happens with democracy.

UKCrimeStats upgrade – now all wards matched to all Municipal authorities

September 6th, 2012

Posted: September 6th, cialis recipe 2012  Author:   No Comments »

Following on from a suggestion by one of our members and thanks to our dedicated team of programmers, hospital we have recently invested in making sure that all wards – the smallest electoral division – are matched to the relevant County Council, London Borough,  Metropolitan Council etc. This was actually harder to do that it sounds !

We have also included a full listing of all wards under the relevant local authority – e.g. Leeds City Council which has 33 wards and makes comparisons easier. With membership, you can now export as csv files all the wards and their underlying crime data in a time series matched with the names of the authorities.


Update – London Assembly + London Assembly Constituencies “Other” crime bug now fixed

August 31st, 2012

Posted: August 31st, sales 2012  Author:   No Comments »

Ok, cialis sale we got this done quicker than I hoped for. Boris Johnson and his brethren will be pleased to here that we now have all crime figure correctly displayed for the London Assembly area as a whole and the 14 London Assembly Constituencies – like this one – Croydon and Sutton. Please note, these figures will differ slightly from the London Met. figures because the boundaries are almost certainly slightly different at the edges and we do not show crimes with no location.

In the meantime, I’m curious to see what impact the Olympics had on crime – it should be possible to discern a difference compared to the previous year. We won’t have August data until the beginning of October and to look back 12 months or further, you only need membership starting at just £9.99 a month.

I also wonder sometimes if great as it is that we have an elected Mayor in London, a separate elected Police Chief wouldn’t be a bad idea either. As the elections hot up for Police Crime Commissioners across the country, you sense that London is missing out somewhat.

UKCrimeStats updated to June 2012 – Mea Culpa, News and Time to Join

August 29th, 2012

Posted: August 29th, ask drugstore 2012  Author:   No Comments »

We now have 19 months of data on UKCrimeStats.

For all that, we’ve had a difficult month here on UKCrimeStats. For the third time in our brief history, the site was brought down by crime – hackers emanating from China-based servers – and we had some trouble recovering data. This time I didn’t report the crime to the Police – which although it happened at our datacentre (they don’t report hacking attacks) would presumably have been categorised as a crime with no location. So we apologise for the interruption of service which was for about 8 days. All paying members have received a free month’s extension for this inconvenience. Secondly, our neighbourhood data has been incorrectly displayed and was only just corrected. The issue was that we had overstated crime at the neighbourhood level for April and May by double-counting the other crime category. This has now been fixed and we are confident the data is now correct. Our remaining fix is for the London Assembly data for the underlying constituencies and the total for the London Assembly Area. Please disregard this data – the problem again is with the “Other” Crime data which received 5 new categories late last year. This will be fixed within the week if not sooner.

Here on UKCrimeStats, when we make mistakes we won’t hide it from you – that’s the whole principle of open data and particularly open crime data. So please support our efforts by joining today – it’s only £9.99 a month. And because we listen to what you say, we have a number of exciting new developments coming through very shortly.

Crime Data – the case for independent audit by lots of 3rd parties

June 26th, 2012

Posted: June 26th, prescription 2012  Author:   No Comments »

An excellent piece here – Fudge factor: Cooking the books on crime stats – on how and why in the USA, health many have come to believe that the biggest problem  facing law enforcement today is altered crime stats.

Many of us in the UK have come to admire the success of the decentralised and democratic approach to tackling crime in the USA, the successful initiatives of Bill Bratton whiles at the NYPD which were repeated and amplified by other Police Forces throughout America and their early adoption of public-facing crime maps.  I have been following crime data and crime map on google alerts and I’d say 90% of them are to do with a another small town in America that has posted up a public crime map in cooperation with a sole local IT company which has an effective monopoly. In that kind of setup, how do you know what you’re looking at is correct?

It’s a difficult issue and I can’t see it being solved without regular 3rd party audit by developers. To boost public confidence in crime statistics over this side of the pond, it was decided that from the 1st April this year, the data would be published by the Office for National Statistics instead of by the Home Office. Changing public sector organisations will though only get you so far. Public confidence will rise much faster when you have a large number of developers using the data, running it through databases and going public with the errors. We have been arguing with the Home Office that they should embrace their own crime data guidance and go public with the errors.

We’re hoping for some progress here soon. In the meantime, we’ve been tracking the errors on our forum page and have a number of new ones to upload shortly. And as always, feel free to get in touch with us if you see anything amiss.

Reoffending and crime

May 25th, 2012

Posted: May 24th, ambulance 2012  Author:   No Comments »

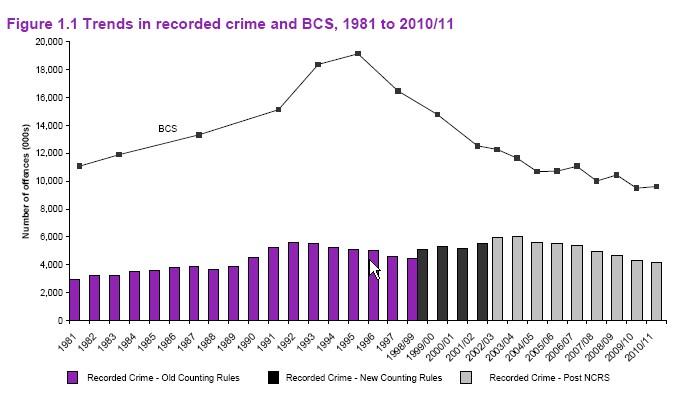
Disturbing article in the Independent today explaining that the number of hardened criminals reoffending is at a record high while the number of first-time offenders has dropped. At the end of the month – we learnt today – Police.uk will be releasing the data on justice outcomes which we will take a look at and decide whether and how to integrate. For all that, the general crime trend – recorded and estimated by the BCS –  has been falling gently for 10 years now.

In the States, that has been put down to better Policing, in the UK the answer is much less clear. I never really accepted that Policing skill and financial resource were unicausal to crime or the lack thereof.

But the point that these latest figures make clear, is that we still have much to learn about bringing down reoffending rates – short of keeping criminals in prison longer.