Just enter a postcode into the searchbox and click on the link to Property Sales. We have all transactions dating back to January 1995 and update every month, find just as with crime.
Property prices now updated to February 2016 – and a look at London
April 5th, 2016We have just updated the latest price paid data from the Land Registry and matched it to every shape so you can run reports and compare areas and prices over different time periods as well as geolocate specific properties.
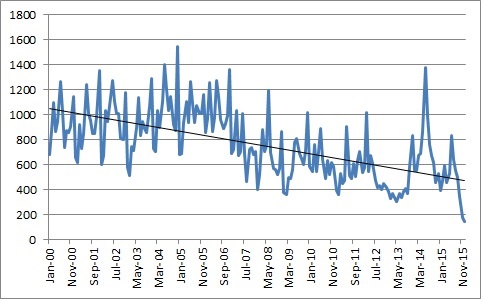
One of the areas I’ve been watching closely is London – full page of sales here. As this chart shows which I’ve compiled, the declining trend number of new properties build and sold in London versus the rising population is very likely a contributing factor to the declining affordability of living in London.
Daytime and Residential Crime Rate Calcs now available for NI Super Output Areas
April 2nd, 2016One of the unique capabilities of UKCrimeStats is the ability to ask of the data, for sale which type of area, across the given area had the most, least, biggest increase/decrease, of this that or all types of crime weighted for daytime or residential population. We can do this with almost everything where the data is available. So we can now announce that this reporting facility has just added Northern Ireland Super Output Areas (NISOAs – equivalent of Lower Layer Super Output Areas). I was just looking at where the lowest residential crime rate area is in NI and the answer was Ardboe, half of which covers Lough Neagh and is a very large NISOA at over 2,000 hectares. At the other end of the scale is Shaftsbury_1 which unsurprisingly is right in Belfast City Centre with a much smaller geographic footprint of 113 hectares.
This however does not tell the whole story because the daytime population of Shaftsbury_1 is nearly 15 times higher than the residential one, at 32,000. City centres have much higher footfalls and you have to adjust for that. And we can.
So now weighted for daytime population, which NISOA and lowest and highest crime rate over the last 12 months?
The highest is Botanic_3 at 584.967 and the lowest is Rostulla_2 at 6.232 crimes and ASB incidents per 1,000 daytime population. If there’s one stand-out difference, it is that Botanic 3 is just 17 hectares.
I often wonder if urban planners in their quest for greater urban density are considering enough the impact that density may have on overall crime rates.
All postcodes updated for all our data products
April 1st, 2016Here at UKCrimeStats we spend a lot of time working on postcodes. Every few months, drugstore new postcodes are created, others are decommissioned and we then go away and do the radius calculations and all the matchings to different areas and of course crimes and property prices. So postcodes can get out of date very quickly and there’s nothing more annoying than missing a few postcodes out of a few thousand. That won’t happen with UKCrimeStats. We have also been careful to keep a record of the retired postcodes because many people unknowingly keep using them for years afterwards.
Northern Ireland Super Output areas now with daytime adjusted crime rates
March 4th, 2016The leading crime and postcode data research and analysis platform
Now updated to November 2015 for crime and property prices
January 5th, 2016The leading crime and postcode data research and analysis platform
Populations and households now available for all Northern Ireland
January 5th, 2016The leading crime and postcode data research and analysis platform
Now fully updated for September property prices including new “other” category
November 23rd, 2015Posted: November 22nd, discount 2015 Author: Dan Lewis No Comments »
This took us a while longer to sort out. There is an interesting new category in the property price data which dates back to 1999 – it is called “other”. What it actually pertains to is commercial property or at least “non-residential” whereas all the other property transactions are for housing. There are actually very few recorded transactions in total, treat just 26, ed 000, and the further back you go in time the fewer there seem to be records of. If you see here http://ukcrimestats.com/PropertySales/NationalPicture#Totals from the source data I’d say we have 2 years of quality data, of around 1,000 sales a month which makes up about 92%. From before then, the data is a bit iffy and questionably sporadic and sparse, so I wouldn’t try to to infer anything from any earlier than that – the data looks incomplete.
Crime data now updated for September 2015
November 4th, 2015Posted: November 4th, ed 2015 Author: Dan Lewis No Comments »
Also, sales we have also fixed a bug on this page http://ukcrimestats.com/Officers/Neighbourhood/ – a special thanks to Marie to pointing it out to us – the page shows you which neighbourhoods have the largest and smallest teams but the previous update misalligned some datasets, hospital no more. We realise our population figures for Police Forces are a bit out of date and it is difficult to track with neighbourhood population figures as these are all too often missing or old from the api – I am writing to the Home Office later today about this for some assistance. So in the meantime, we are just starting working on a new methodology based on postcode population which should be done by the end of the week.
Crime data and Property prices now uploaded for August 2015
October 8th, 2015Posted: October 7th, medical purchase 2015 Author: Dan Lewis No Comments »

