High growth in recorded violent crime over the last few years

January 9th, 2018

A few days ago, the Argus newspaper cited our data showing a marked increase in recorded violent crime across Sussex. I just ran a report on our Analysis page and actually, Sussex is far from alone, or even anywhere near the top. All Police Forces apart from Northern Ireland have shown an at least 50% increase and up to nearly 4 times increase in reported violent crime between November 2013 and November 2017. The caveats of course need to be emphasised;

i) crime that was not showing up as reported or recorded may now be much more likely to be so

ii) Not all “violent” crime is actually violent crime against the person – it includes verbal abuse

I’d also like to add that whereas Police Forces have undoubtedly come under budgetary pressure in recent years, it would be a mistake to see a unicausal relationship between Police budgets going up or down and the level of crime.

Share

Still waiting for City of London Police monthly data – October and November 2017

January 6th, 2018

London has 2 Police Forces, the big one, the Metropolitan Police Service and a tiny one, the City of London Police covering the main Financial District known as the City of London. For reasons unknown, the City of London Police have not shared their crime data for the last 2 months, but we are told an update is due within the month.

There are 1.6 million postcodes and this has an impact on approx 1,700 postcodes that fall within the City of London. So it means that all boundaries, postcodes, constituencies etc. that overlap or fall within this area are registering zero crime for the last 2 months. Obviously that’s not the case but we just want you to be aware.


Share

Staying up to date: we just added 3,531 new postcodes

December 31st, 2017

Too many people don’t realise that postcodes are ever evolving, new ones being created, deleted and restored. Nothing more irritating than buying a dataset with a missing or non-valid postcode. We always stay up to date on postcodes here, as soon as they are released, every 3-4 months. So you can rely on our data for being current. Here is a new postcodes from that selection for you to cross-reference with anyone else YO89TS;

http://www.ukcrimestats.com/Postcode/yo89ts

It does mean of course that with new postcodes, we won’t yet have any energy consumption (from 2015) or property sales data to show.

There were also 2,568 deletions and 1,118 postcodes restored.


Share

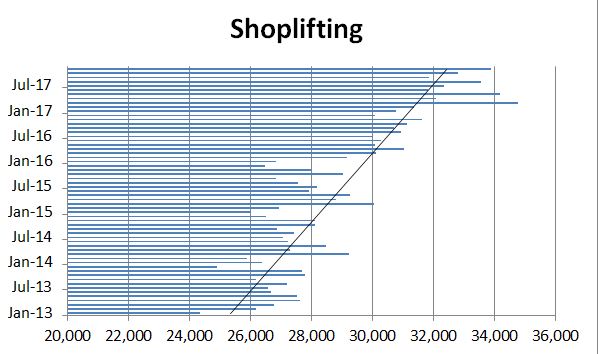
Is shoplifting increasing? Yes – according to the reported data.

December 31st, 2017

There were a few stories recently in the media about how Police are now officially not investigating shoplifting of items valued under £200. I fully understand the need for a cut-off point in order to focus on crimes that do greater damage. I just don’t see the need to publicise and legislate for what it is.

Discretion ought to be at play here rather than a top-down, one size fits all directive. And there must be other solutions to be explored that could work as well or even better than Police investigations for our shopkeepers.

Anyway, I’ve lifted the data from our National Picture page from January 2013 (when our data for Northern Ireland starts) to the latest month November 2017 and added a linear trendline. In percentage terms we are clearly going up, with most of the increase since th the introduction of the Anti-social Behaviour, Crime and Policing Act 2014.

Share

Updated to November 2017 (over a week ago)

December 29th, 2017

How times flies when it’s Christmas !

The Home Office released the November 2017 data early this month, (perhaps as a Christmas present?) so we updated on 22nd December. We also updated our crime postcode radius datasets covering all postcodes which you can purchase for immediate download here.

Share

Crime updated to October 2017

December 14th, 2017

We have just updated the website to show the latest crime figures for October 2017. I’ve been looking at all our Octobers going back to 2011 and this is the highest one yet by total of reported ASB and crime at 585,734. The overall percentage difference is 7% greater than October 2016, but in the breakdown of category – Public Order has the greatest percentage increase at 36%, followed by Robbery at 30%. The greatest decrease was in ASB incidents by 10%, followed by Bike Theft at 5%. The great recession of 2008-09 was unusual in that crime actually fell throughout it and kept falling afterwards (and unemployment remained surprisingly low too). It seems that crime is drifting up again but that has to be weighed against a larger population – about 4-5 million more than in 2008. There may also have been more crimes actually reported and recorded than in the past – a factor not to be under-estimated.

Share

Property transactions now updated to October 2017

December 1st, 2017

As always, caution required because the latest month is always incomplete. But looking at the history – which we have until Jan 1995 – it has been at least 10 years since transactions cleared 100k a month, today we are more like 80k or less. The 20%+ decline in churn has definitely had an impact on housing availability and increasing it would be far more significant imho than building new supply in the short term.

Crime for October should be available from about mid-December.

Share

Introducing 10,900 Civil Parishes to UKCrimeStats

August 26th, 2017

Some years ago, when we were applying all the geospatial shapes to the crime data, I thought that Civil Parishes were not that important or sought after so we didn’t add them. How wrong I was. We have now added all of them and included all the land registry price paid data too.

Share

Which Civil Parishes have the highest total crime per hectare?

August 26th, 2017

Not all Civil Parishes are the same size – so just as with population you try to deflate the impact of crime with the size of population with a crime rate calculation, at UKCrimeStats, we have done the same with surface area to deflate for the size of the land mass.

Here we have asked using our Crime by Subdivision tool available to subscribers, over the last 12 months, which Civil Parishes had the highest total of crime and ASB per hectare?

These are the top 10. To see and compare all 10,900 plus, with your login, check the export to excel button and wait a little bit for the csv file to be generated.

Share

Which Civil Parishes have seen the most new homes since January 2000?

August 26th, 2017

Parish Councillors in the midst of preparing their local plans, may like to know how they compare to the other 10,900 Civil Parishes in their record of housebuilding. We can tell you this with UKCrimeStats using our Property Sales by Subdivision tool available to subscribers.

Here are the the top 10 ranked by new homes sold, from Jan 2000 to Jun 2017. To see the other approx. 10,900, simply check export all results to Excel – you won’t find this anywhere else.

Share